ELECDURA NETWORK

Your Whole New Supply Chain For Heavy-Duty Parts
Whatsapp:
+86 18915027366
Phone:
+86 18915027366
Views: 0 Author: Site Editor Publish Time: 2026-07-18 Origin: Site
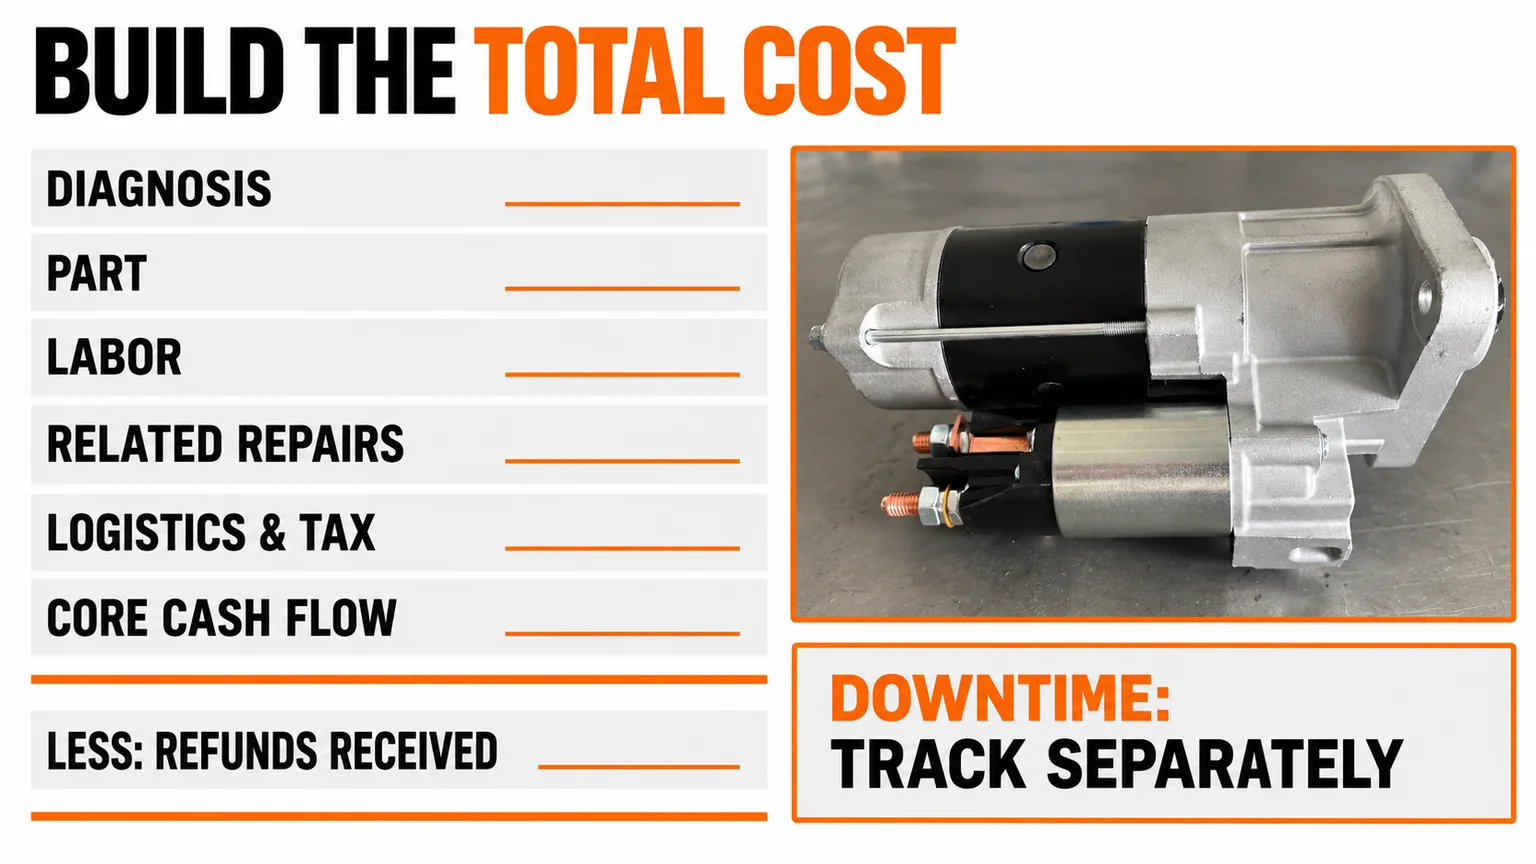
Heavy-duty starter motor replacement cost includes more than the price of the starter itself. A useful estimate accounts for diagnosis, parts, removal and installation labor, related electrical repairs, freight, taxes, vehicle downtime, and the commercial terms attached to the replacement. A core charge may temporarily increase the cash required, but an eligible core refund reduces the final net cost once it is received.
Before comparing quotations, confirm that the starter is actually the failed component and that each proposed replacement matches the engine and vehicle application. A lower unit price can become more expensive if it leads to incorrect fitment, additional workshop time, emergency shipping, or a repeat removal. The best decision comes from comparing the same cost categories and verified technical requirements across each option.
Set the scope before comparing prices. Decide whether the estimate covers only the replacement part or the complete event from diagnosis through return to service. For fleet budgeting, use the complete event so hidden costs are not left outside the comparison.
Cost item | What to record | Cost treatment |
|---|---|---|
Diagnosis | Battery and cable checks, control-circuit tests, starter assessment and any required inspection | Include the actual diagnostic charge, whether or not the starter is replaced. |
Replacement part | Starter type, confirmed reference, supply condition and included components | Compare equivalent applications and supply scope. |
Removal and installation labor | Access, electrical isolation, removal, mounting inspection, refitting and acceptance checks | Use the workshop's application-specific estimate rather than a universal labor allowance. |
Related corrective work | Battery, cable, ground, terminal, mounting or ring-gear work identified during diagnosis | List separately so the root cause and total repair scope remain visible. |
Freight and taxes | Delivery, expedited shipping, applicable duties and taxes | Normalize quotations to the same currency and delivery basis. |
Core charge and refund | Deposit, eligibility, return deadline, freight responsibility and expected refund | Track the deposit as cash tied up; deduct the refund when received. Count unrecovered amounts and return costs separately. |
Downtime and recovery | Vehicle unavailability, towing, substitute equipment, overtime or disrupted operations | Estimate using the fleet's own operating data and keep assumptions visible. |
Warranty administration | Required evidence, shipping, labor coverage, authorization and claim handling | Include known charges and unresolved exposure; do not assume every warranty covers labor or downtime. |
For a consistent comparison, calculate the net replacement event cost as follows:
Net replacement event cost = diagnosis + part price + labor + related repairs + delivery freight and nonrecoverable taxes + core deposit paid + core-return freight and handling + other documented cash costs − core refund actually received − other refunds and credits actually received.
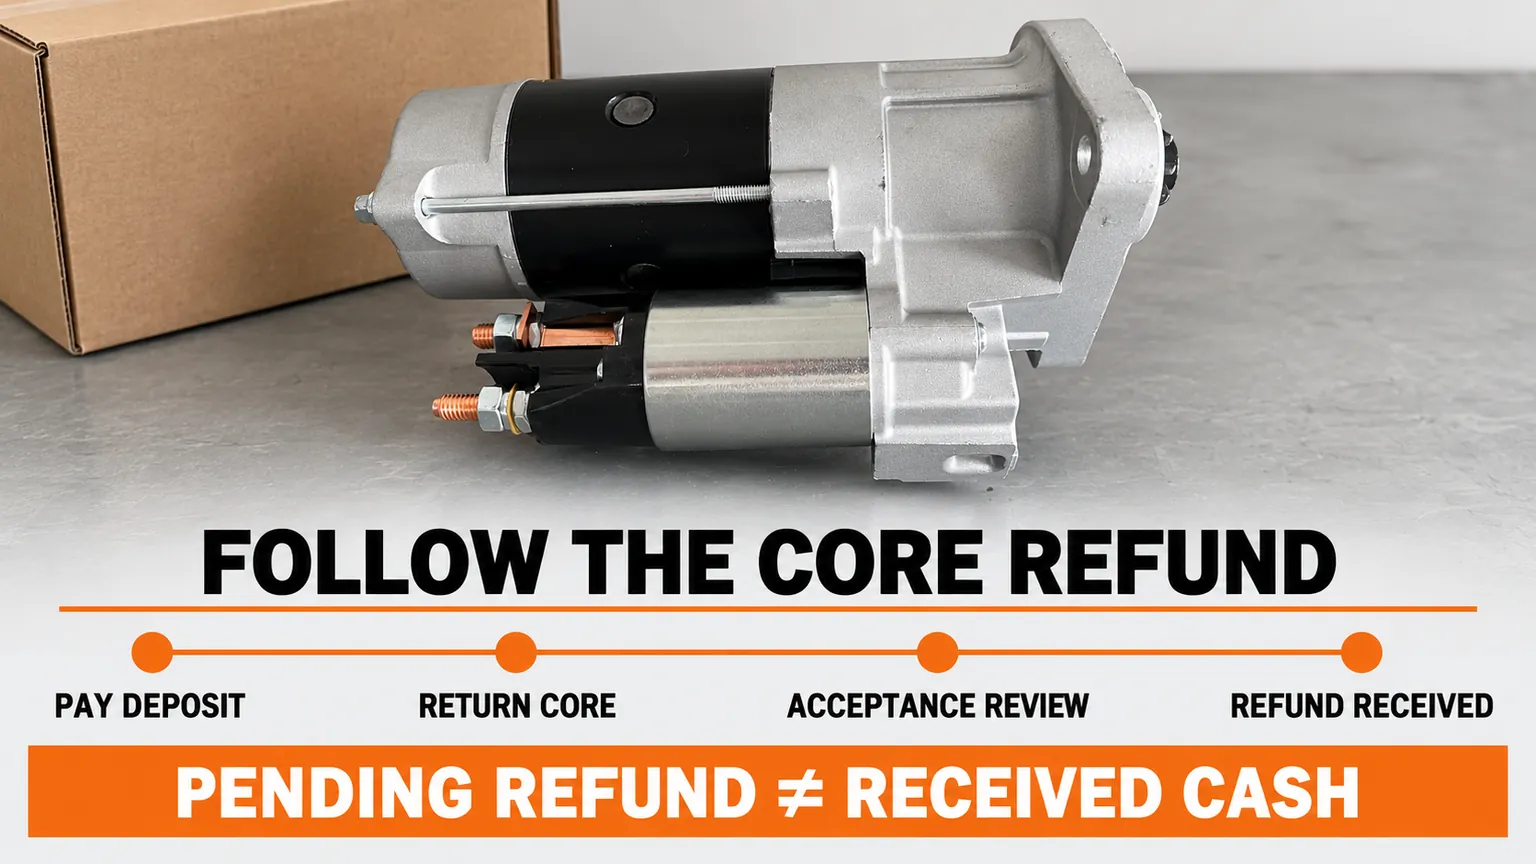
Count the core deposit paid once and subtract the actual refund once. If the core is accepted and the full deposit is refunded, the deposit's net cost impact is zero. Any amount withheld or not refunded remains a cost, while return freight and handling fees are recorded separately. If a refund has not arrived, mark it as pending rather than subtracting it as money already received; update the calculation when the refund is confirmed.
Compare quotations using the same cost scope and currency, and distinguish confirmed cash costs from estimated downtime, lost operating contribution, or other uncertain impacts. Record the assumptions behind these estimates separately so they inform the decision without being presented as invoiced or confirmed amounts.
Cost categories, received refunds and separate downtime tracking for starter replacement.
A no-crank or slow-crank complaint does not automatically establish starter failure. A discharged or damaged battery, excessive resistance in the positive or ground cable, a control-circuit fault, a failed solenoid, damaged connections, or mechanical resistance can create similar symptoms.
Delco Remy's heavy-duty diagnostic guidance recommends separating no-click/no-crank, click/no-crank, and slow-cranking complaints, then checking battery condition and cable voltage drop before deciding whether the starter itself needs replacement. The specific test conditions must follow the relevant starter and vehicle instructions.
Before approving a replacement, record the complaint, battery test results, relevant voltage-drop measurements, control-circuit findings, and evidence of starter or drive damage. If the problem is in a cable, ground, battery or control circuit, replacing the starter without correcting that fault can leave the original complaint unresolved.
Option | When it may fit the requirement | What to compare |
|---|---|---|
New replacement starter | The existing unit is unsuitable for repair, or a complete replacement fits the required service plan. | Application match, product identity, specification, delivery, included parts and applicable warranty terms. |
Remanufactured starter | A documented remanufacturing process and traceable acceptance evidence are available. | Process scope, reused and replaced components, test records, core terms and warranty handling. |
Repair of the existing unit | Diagnosis identifies a repairable fault and the remaining assembly is serviceable. | Inspection findings, repair scope, parts and labor, test evidence, turnaround time and repeat-work risk. |
These options should be compared using actual quotations and documented conditions. Repair may be economical when the fault is limited and the remaining unit is serviceable, but major damage or additional labor can change the result. A remanufactured unit is not automatically equivalent to a new unit; the process and acceptance criteria must be established. A new starter is not automatically the lowest-cost choice once fitment, freight, downtime and other costs are included.
Two starters that look similar or share a family name may differ in ways that affect installation or operation. Confirm the original reference and the complete application rather than relying on appearance alone.
Vehicle, engine model and relevant application details.
Original starter part number or verified OE reference.
Electrical system voltage and the specified starter configuration.
Rated power or application specification where documented.
Rotation, pinion configuration, mounting interface and installation clearance.
Solenoid position, terminal arrangement and connector details.
Required accessories, mounting hardware and supply scope.
Do not assume a part is compatible because its voltage, product family or external housing looks correct. Resolve discrepancies in the original label, application details and technical documentation before placing an order.
Starter access varies by vehicle and engine layout. Exhaust components, guards, frame equipment and surrounding installations can affect removal and refitting time. Ask the workshop to identify the expected tasks and any corrective work separately instead of applying an assumed labor allowance to every truck.
Downtime also depends on the vehicle's role, access to a spare, delivery timing, and whether the fault occurs during scheduled maintenance or an unplanned roadside event. Use the fleet's own records to estimate the impact rather than applying a made-up daily cost.
For a core-return program, confirm the eligibility standard, return deadline, required documentation, packaging, freight responsibility and refund process before purchase. A damaged, incomplete or late-returned core may not qualify for the full refund. The deposit itself is primarily a cash-flow issue while it remains refundable; return freight, handling charges and any rejected portion affect the final net cost.
Core deposit, return, review and received-refund sequence.
The starter should not be accepted on appearance alone. Use the applicable vehicle and starter service procedure to confirm that the correct part was installed and that the starting system operates as intended.
Confirm the installed part reference, voltage, mounting and terminal configuration.
Inspect the flywheel ring gear and related drive components as required by the service procedure.
Verify battery condition and the main positive and ground connections.
Check relevant cable voltage drops and control-circuit behavior under the specified test conditions.
Record cranking performance, abnormal noise, engagement and release behavior, and any remaining faults.
Retain the invoice, installation record, test findings and warranty documentation.
A successful start after installation is useful evidence, but it does not replace required checks of the electrical circuit and mechanical interfaces. Acceptance criteria must come from the specific vehicle and starter documentation; do not use a universal voltage, current or cranking-time threshold for every application.
The complete estimate may include diagnosis, the starter, removal and installation labor, related electrical or mounting repairs, freight, taxes, core-return handling, downtime and warranty administration. Ask each provider to separate these items so quotations can be compared on the same basis. Not every event will require every item, and costs should reflect the actual application and findings.
Not necessarily. A core charge is often a deposit tied to the return of an eligible old unit. Track the deposit as temporary cash tied up, then subtract the refund when it is received. Return freight, handling fees and any amount withheld because the core fails the acceptance rules affect the net cost. Confirm those rules before ordering.
No. Compare the actual delivered price, core terms, labor, warranty scope, turnaround time and evidence of the remanufacturing process. A lower initial quote may involve a larger deposit, additional freight or uncertain core eligibility. A new unit may also carry costs or benefits that depend on the specific offer. The choice should follow equivalent quotations, not a general assumption.
No. Access depends on the chassis, engine, nearby equipment, guards and installation layout. Use an application-specific workshop estimate that identifies removal, refitting, corrective work and final testing. Fleet history can improve future budgeting for recurring applications, but it should not be presented as a universal labor allowance.
Not before checking the starting system. Battery condition, positive and ground cable resistance, control voltage, connections, mechanical load and starter condition can all affect cranking. Follow the relevant diagnostic procedure and replace the starter only when the evidence supports that decision. Otherwise, a new unit may leave the original fault unresolved.
Before requesting a quotation, prepare the original starter number or OE reference, vehicle and engine details, system voltage, available starter specifications, mounting and pinion photographs, and the required quantity. Include the diagnostic findings, any related repairs identified, and whether the inquiry concerns a new unit, remanufactured unit or repair of an existing starter.
If a core-return arrangement is offered, ask for the deposit, eligibility requirements, deadline, freight responsibility and refund process in writing. Also confirm what is included in the price, the applicable warranty conditions and what technical evidence is available for the proposed unit.
Review the heavy-duty starter motor category, then submit the available application information through the Elecdura contact page for review. Compatibility, price and availability must be confirmed for the specific requirement; a product reference or inquiry does not guarantee stock or fitment.